What is the percentage chance a team wins the game based on the closing point spread?

SPONSOR: If interested in college basketball, college football or WNBA picks, check out Right Angle Sports at handicapper.net or on Twitter at @RASPicks.

Using the handy spread-to-moneyline converter available at SBR Forum, we came up with tables for favorite and underdog win percentages based on the point spread across the NFL, college football, NBA and college basketball.

Note: You can also use these to calculate projected wins for a season based on projected — or actual — point spreads. For example, the Seahawks are favored by 5 over the Packers in the Thursday Night opener, so that’d count as 0.681 wins for Seattle and 0.319 wins for Green Bay. Do that a bunch of times and you get a rough estimate of the “Vegas projection” (or, more accurately, the CG Technologies projection) of wins for each NFL team.

NFL

SpreadFavoriteUnderdog
050.0%50.0%
0.550.0%50.0%
151.3%48.8%
1.552.5%47.5%
253.5%46.5%
2.554.5%45.5%
359.4%40.6%
3.564.3%35.7%
465.8%34.2%
4.567.3%32.7%
568.1%31.9%
5.569.0%31.1%
670.7%29.4%
6.572.4%27.7%
775.2%24.8%
7.578.1%21.9%
879.1%20.9%
8.580.2%19.8%
980.7%19.3%
9.581.1%18.9%
1083.6%16.4%
10.586.0%14.0%
1187.1%12.9%
11.588.2%11.8%
1288.5%11.6%
12.588.7%11.3%
1389.3%10.7%
13.590.0%10.0%
1492.4%7.6%
14.594.9%5.1%
1595.6%4.4%
15.596.3%3.7%
1698.1%1.9%
16.599.8%0.2%
17+100.0%0.0%

COLLEGE FOOTBALL

SpreadFavoriteUnderdog
050.0%50.0%
0.550.0%50.0%
151.2%48.8%
1.552.5%47.5%
253.4%46.6%
2.554.3%45.8%
357.4%42.6%
3.560.6%39.4%
461.9%38.1%
4.563.1%36.9%
564.1%35.9%
5.565.1%34.9%
666.4%33.6%
6.567.7%32.3%
770.3%29.7%
7.573.0%27.0%
873.8%26.2%
8.574.6%25.4%
975.1%25.0%
9.575.5%24.5%
1077.4%22.6%
10.579.3%20.8%
1179.9%20.1%
11.580.6%19.4%
1281.6%18.4%
12.582.6%17.4%
1383.0%17.0%
13.583.5%16.5%
1485.1%14.9%
14.586.8%13.2%
1587.4%12.6%
15.588.1%12.0%
1688.6%11.5%
16.589.1%11.0%
1791.4%8.6%
17.593.7%6.3%
1895.0%5.1%
18.596.2%3.8%
1997.3%2.7%
19.598.4%1.6%
20+100.0%0.0%

NBA

SpreadFavoriteUnderdog
050.0%50.0%
0.550.0%50.0%
151.1%48.9%
1.552.3%47.7%
254.3%45.7%
2.556.3%43.7%
358.2%41.8%
3.560.1%39.9%
461.9%38.1%
4.563.6%36.4%
565.8%34.2%
5.568.0%32.0%
670.1%29.9%
6.572.1%27.9%
774.2%25.8%
7.576.3%23.8%
878.4%21.7%
8.580.5%19.6%
982.8%17.2%
9.585.2%14.8%
1087.3%12.7%
10.589.4%10.6%
1191.3%8.7%
11.593.2%6.8%
1295.0%5.0%
12.596.8%3.2%
1398.7%1.3%
13.5+100.0%0.0%

COLLEGE BASKETBALL

SpreadFavoriteUnderdog
050.0%50.0%
0.550.0%50.0%
151.7%48.3%
1.553.5%46.5%
255.4%44.6%
2.557.4%42.6%
359.7%40.3%
3.562.1%38.0%
464.1%35.9%
4.566.2%33.8%
568.2%31.8%
5.570.2%29.8%
672.0%28.1%
6.573.7%26.3%
775.8%24.3%
7.577.8%22.2%
879.8%20.3%
8.581.7%18.3%
983.8%16.2%
9.585.9%14.1%
1088.1%11.9%
10.590.3%9.7%
1192.4%7.6%
11.594.5%5.5%
1296.7%3.3%
12.598.9%1.1%
13+100.0%0.0%

Want to win earn a spot in the BCS national championship game? Cover the point spread

National champions need to cover the spread. And they’ve done exactly that during the BCS era.

The last 15 national champions went a combined 123-63-2 against the spread during their title seasons. Those teams earned a shot at the BCS crown by winning impressively, something that’s hard to do without covering the spread.

A team’s record against the spread shows whether it has exceeded or failed to meet the betting market’s expectations. At the end of the regular season, when splitting hairs between the nation’s elite teams, records against the spread can identify which teams have accomplished more than was expected.

In some cases, a team’s record against the spread can be a better indication of its overall performance than strength of schedule. Teams have little control over how opponents scheduled years in advance fare throughout the season. But they can control how they perform against those opponents. And one of the best ways to determine the level of their performance, regardless of the competition, is by comparing the result with the point spread.

Todd Fuhrman, sports betting analyst for Don Best and Fox Sports 1, disagrees and doesn’t believe a team’s record against the spread is a fair gauge, especially for the top public favorites who may be faced with inflated point spreads.

“The goal of the oddsmaker is to try to discourage people from betting the best teams. So if Alabama goes 10-2 against the number, the house hasn’t done a good job of setting prices,” Fuhrman said. “So that’s penalizing teams that are good. In the ideal scenario, a bookmaker wants anybody in the Top 5 to go 0-12 against the spread.”

If that’s the case, oddsmakers have underperformed. The last 15 national champions have covered the spread in 65 percent of their games. The 2007 LSU Tigers are the only BCS national champion to finish their title season with a losing record against the spread. Since 1998, nine of the eventual 15 national champions have started the season ranked in the top 5.

What the BCS title game point spreads mean

The Golden Nugget sportsbook has opened betting on the most likely matchups in the BCS National Championship Game:

  • Alabama -5 vs. Florida State
  • Alabama -8.5 vs. Baylor
  • Alabama -10.5 vs. Ohio State
  • Florida State -4.5 vs. Baylor
  • Florida State -6.5 vs. Ohio State
  • Baylor -4 vs. Ohio State

The Alabama-Florida State line has generated the most betting action. According to Golden Nugget college football odds specialist Aaron Kessler, 90 percent of the action on that game has been on the Seminoles. The Nugget is taking $2,000 limits on the early BCS lines. Every limit bet that had been placed as of Wednesday was on Florida State, and there have been a few.

“Alabama was -6.5 last week, and money drove it down to 4,” Kessler said.

While the potential showdown between the Crimson Tide and Florida State is generating the most betting buzz now, if either team slips up in the coming weeks, the Baylor-Ohio State point spread will become the hotter topic. The Bears are the favorites, but that doesn’t mean Baylor is the more deserving team. That’s not what the point spread is designed to indicate.

A look back at Auburn’s 2010-11 national championship season shows why it’s unwise to say one team is more deserving than another strictly because they’d be favored over that opponent. The unbeaten Tigers were 4.5-point road underdogs to a two-loss Alabama team in the 2010 Iron Bowl. Auburn came back from a 21-0 deficit to win, 28-27, and advance to the SEC championship game and eventually the national championship Game. Multiple oddsmakers at the time said they still would have made Alabama a favorite over Auburn if the two teams were to meet on a neutral-field bowl game.

Alabama is in a similar position this season. The Crimson Tide could lose to Auburn or in the SEC championship game and would still be favored over Baylor or Ohio State.

How Baylor is shredding Vegas: Story behind the big bet that jolted the Bears’ BCS odds

A large bet on Baylor to win the national championship has forced one Vegas sportsbook to take drastic measures.

After beginning the season at 200-to-1, Baylor is now 6-to-1 to win the BCS title at the Las Vegas Hotel & Casino SuperBook.

The SuperBook took a big bet on Baylor at 75-to-1 in mid-September. SuperBook head oddsmaker Ed Salmons wouldn’t reveal the exact amount of the bet, but characterized it as “large enough to make us take notice.” It also forced him to slash the Bears’ odds drastically.

“It was a big bet. I don’t need any more Baylor money,” said Salmons, who opened the Bears at 300-to-1 to win the title in January.

The attention-grabbing bet was placed by a house player, a term for a high-roller who frequents the hotel and casino table games, but is not necessarily a sharp sports bettor. The SuperBook normally will take up to $50,000 in liability on a futures bet, but Salmons noted that they’ll extend those limits for house players. At 75-to-1, it doesn’t take much to expose the book.

“We don’t have a lot of tickets on (Baylor), but they are our biggest liability now,” Salmons admitted.

Other Vegas books have the Bears at higher odds to win the national title, but they’re all wary of Art Briles’ team.

Baylor has already done plenty of damage to the books. The Bears have covered the spread in 10 consecutive games, the longest such active streak in the nation. Twenty-three of their last 29 games have gone OVER the total. The books feel helpless.

“The bettors bet Baylor every week. It doesn’t matter what the spread is,” said Salmons, adding that he’s inflating the Bears’ lines every week. “Obviously, they’re inflated. If you break down the line on the West Virginia game (Baylor -30), Baylor is the highest power-rated team in the country. These teams that play in the no-huddle, especially against the weaker teams, you can take their spread and add 10. That’s how silly they are. And it doesn’t matter what you put on Baylor.”

On Sunday, prominent offshore sportsbook Bookmaker opened Baylor as a 10.5-point favorite at Kansas State. The line surged to Baylor -20, before moving back to the current line of minus-17.5.

As of Wednesday morning at the SuperBook, there had not been a single bet placed on the Wildcats plus the points.

“I know one thing: The computers think Baylor is a cross between the Denver Broncos and the Steelers of the 70s,” Salmons said. “One of my buddies has a computer that takes the teams’ scores and compares them. It ranks the teams on who you played and how you did. And it has Baylor No. 1. I know his system is used by a lot of the BCS.”

Salmons added that if Ohio State and Baylor played on a neutral field this weekend, he’d make the Bears 7.5-point favorites.

Baylor isn’t the only team shredding Vegas this season, though.

“Baylor’s been a thorn in my side, but Oregon’s been a bigger thorn,” said John Avello, executive director of the Wynn sportsbook.

The Ducks have covered the spread in seven consecutive games, including all four this season. Avello includes Clemson and Florida State into the group of teams that have been hard for the books to handle.

“If a team can score points, the public is going to bet them,” Avello said. “They aren’t going to worry about covering 28 or 35 points.

“There’s really been no surprises in college football,” Avello added. “The problem we’re having right now is it’s too predictable. Anytime it’s too predictable, it’s when we’re going to get hurt.

Avello mentioned that, if Baylor and Oregon were to meet in a bowl game, he’d make the total on the game an even 100.

Salmons agreed.

“I’m telling you, we’re not that far away from seeing a college football total of 100,” he said. “We’re getting closer.”

Unbeaten odds: Oregon has best chance of running table, but what about Baylor?

We’re already to the time of year in college football where the inevitable questions are popping up.

“What happens if three or more teams finish undefeated? Would Baylor get in over Ohio State? What about Clemson? Where do they stand? Is the ACC stronger than the Pac-12? Shouldn’t Florida State get in over Oregon if both go unbeaten? What about Louisville? Where do they rank in all of this? Can’t we just have a playoff already!?”

And maybe, just maybe, this will be the year where it actually happens. Where multiple teams finish the season with perfect records in the final year of the awful BCS, and we have to debate the regular-season merits of three or more schools.

By using projected point spreads (derived from Games of the Year lines), we’ve calculated win odds for each team and determined their chances of remaining unbeaten throughout the regular season.

A few notes:

  • This is regular-season only. (It’s also power conference only. Sorry, Northern Illinois, Fresno State and Houston.) Conference championship games—which tend to throw a wrench in the national championship picture from time to time—aren’t included. Therefore, ignore the Week 15 numbers for teams that would have to play in conference championships.
  • Oregon (63%) has the best chance of anyone, with the toughest tests remaining at Washington this week and at Stanford in Week 11.
  • Baylor (30.1%), looking like it could steamroll through the weak Big 12, has a much better chance than conference-mate Oklahoma (6.9%), mainly because the Bears are projected 7.5-point favorites over the Sooners at home in Week 11.
  • It “should” be smooth sailing for Alabama (54.1%), but the Crimson Tide are only 7-point projected favorites in their showdown with LSU in Week 11.
  • If you haven’t caught on, we should probably wait until after Week 11 to really worry about any of this.
  • UCLA, Michigan, Texas Tech and Missouri all have less than a 2% chance of running the table.

* * *

RANKTEAMAFTER WEEK 789101112131415
1Alabama100%100%100%100%70%63.7%63.7%54.1%CC
2Oregon84%84%84%84%63%63%63%63%CC
3Clemson100%51%42.3%42.3%42.3%35.6%35.6%17.4%CC
4Ohio State100%91%77.4%77.4%77.4%70.4%61.2%34.9%CC
5Stanford75%55.5%42.7%42.7%10.7%7.5%7.5%6.2%CC
6Florida State100%49%49%39.2%39.2%39.2%39.2%21.2%CC
8Louisville91%73.7%73.7%73.7%73.7%69.3%69.3%69.3%58.9%
11UCLA100%26%0%0%0%0%0%0%CC
12Oklahoma85%85%72.3%72.3%19.5%18.7%13.9%13.9%6.9%
13Miami Florida100%79%79%15.8%10.4%8.3%8.3%6.2%CC
15Baylor95%95%95%95%69.4%58.9%37.1%30.1%30.1%
18Michigan57%43.9%43.9%23.3%16.3%8.3%4.1%1.7%CC
20Texas Tech88%71.3%10.7%3.2%2.4%0.4%0.4%0.2%0.2%
25Missouri25%12.3%5.8%4.5%3.5%3.5%2.1%0.8%CC

Urban Meyer to recruit: ‘Don’t bet against the Buckeyes. Well, actually, don’t bet at all’

There has been no better spread-covering coach through the years than Urban Meyer, and that’s been particularly true in non-conference play, where Meyer has earned a reputation for running up scores against lesser opponents.

Meyer entered the 2013 season with a 35-10 ATS record in non-con games, far and away the best mark of any active coach.

Before Ohio State’s season opener against Buffalo, Sports Illustrated was granted behind-the-scenes access with Meyer and his team. One of the most interesting anecdotes from the story, written by Pete Thamel, comes from a phone conversation Meyer had with a potential recruit.

From SI.com:

When assistants would get a player on the phone, they’d hand him off to Meyer, who frequently stopped meetings to have a chat with a prospect. He ended one call memorably: “Don’t bet against the Buckeyes this year.” Then he stopped himself and smiled, “Well, actually, don’t bet at all.”

Meyer should have stuck with his first instinct.

The Buckeyes are 3-1 ATS this year, and have covered three straight by an average of 12 points.

Stock Watch: An updated look at college football Games of the Year lines after Week 1

Before the college football season began, the LVH SuperBook in Las Vegas released Games of the Year lines on roughly 100 marquee matchups from late August to mid-December.

The lines went off the board prior to opening weekend and have since been adjusted. A closer look at them illustrates how much can change in just one week.

Here are a few teams whose stocks are up or down after Week 1 games:

  • Kansas State (down): The Wildcats lost to FCS North Dakota State at home, and as a result, went from 17-point favorites in their season finale against Kansas to 11-point favorites. Two other lines involving K-State (vs. Oklahoma and TCU ) also moved against them.
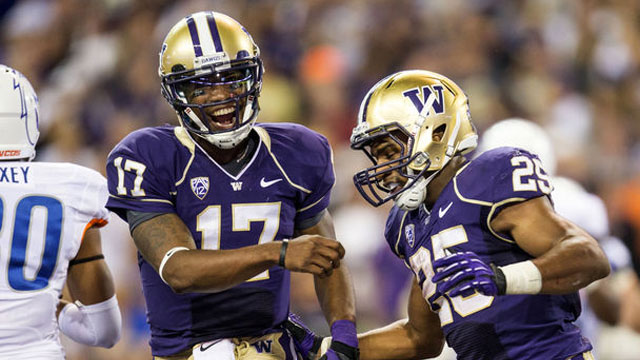
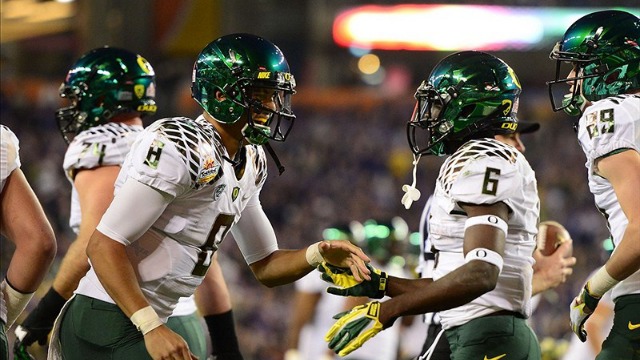
  • Washington (up): Steve Sarkisian’s Huskies gave Boise State its most thorough beating in the Chris Petersen Era, and oddsmakers took notice. In an Oct. 12 meeting against Oregon, Washington is listed as 9.5-point underdogs after being +13.5 just four days ago.
  • Oregon State (down): Ouch. After giving up 49 points in a loss to Eastern Washington, all five Oregon State lines moved against them, including the Nov. 1 home game against unimpressive USC.
  • Utah State (up): The Aggies didn’t beat rival Utah, but left a favorable impression. Two lines moved 4.5 points in their favor, and a third, against disappointing Boise State, moved six points.

All updated lines are listed below, courtesy of the LVH SuperBook. Numbers in parentheses are from Aug. 26, three days before the season started.

* * *

TCU -3 (-5.5)
Texas Tech

Air Force
Boise State -19 (-20)

UCLA
Nebraska -4 (-7.5)

Alabama -7 (off)
Texas A&M

Iowa -3 (-1)
Iowa State

Oregon State -1 (-3.5)
Utah

Wisconsin
Arizona State -3.5

Clemson -9.5
NC State

Boise State (-1)
Fresno State -4.5

Utah
BYU -5 (-6)

Arizona State
Stanford -9.5 (-8.5)

Michigan State
Notre Dame -6.5 (-5.5)

Virginia Tech
Georgia Tech -3 (-1)

Utah State -3.5
San Jose State (-1)

LSU
Georgia-3 (-4.5)

USC
Arizona State -4.5 (-1.5)

Oklahoma
Notre Dame -2 (-1)

Wisconsin
Ohio State -10 (-9.5)

Texas -17 (-14.5)
Iowa State

UCLA -4 (-2.5)
Utah

BYU (-2)
Utah State -2.5

TCU
Oklahoma -6 (-7)

Notre Dame -2
Arizona State

Ohio State -11.5 (-7.5)
Northwestern

Rutgers
Louisville -13.5 (-11.5)

Arizona
USC -10.5 (-10)

Temple
Cincinnati -18 (-17)

Texas -3 (-1)
Oklahoma

Florida
LSU -3.5 (-3)

Stanford -10.5 (-10)
Utah

Oregon -9.5 (-13.5)
Washington

Michigan -3
Penn State

Boise State (-4)
Utah State -2.5

Miami
North Carolina -3

Central Florida
Louisville -11 (-10.5)

Florida State
Clemson -1 (-1.5)

Florida -7 (-8)
Missouri

TCU
Oklahoma State -7

LSU -3.5 (-2.5)
Ole Miss

UCLA
Stanford -10 (-11.5)

USC
Notre Dame -4.5 (-3.5)

Kentucky
Mississippi State -11.5

Boise State 
BYU -3 (-1.5)

South Carolina -7 (-7.5)
Missouri

Tennessee
Alabama -27.5 (-28)

Texas -3 (-2.5)
TCU

UNLV
Nevada -7 (-13)

UCLA
Oregon -15.5 (-18.5)

Stanford -7 (-3.5)
Oregon State

Arizona State -10 (-12.5)
Washington State

USC -1
Oregon State (-1.5)

Miami
Florida State -12.5 (-9)

North Carolina -1 (-4.5)
NC State

Michigan -2.5
Michigan State (-3)

Florida
Georgia -2 (-2.5) 

Oklahoma -3 (-6)
Baylor

Oregon -3 (-4)
Stanford

Louisville -12.5 (-8)
UConn

Nebraska
Michigan -3.5 (-3)

BYU
Wisconsin -9.5 (-7)

LSU
Alabama -11.5 (-12)

Georgia Tech
Clemson -9.5 (-11)

Washington
UCLA -3 (-4)

Florida
South Carolina -3 (-3.5)

TCU -4.5 (-2.5)
Kansas State

Michigan State
Nebraska -6.5 (-4)

Michigan -6 (-3)
Northwestern

Oklahoma State
Texas -4.5

Stanford -3 (-1)
USC

UNLV
Air Force -7 (-9)

Navy
San Jose State -7.5

Nebraska -1.5 (-2.5)
Penn State

Vanderbilt
Tennessee -1

Oklahoma -7.5 (-6.5)
Kansas State

Michigan State PK (-1)
Northwestern

Oregon -16.5 (-13.5)
Arizona

Washington -1.5
Oregon State (-5)

Arizona State
UCLA -3 (-1)

BYU
Notre Dame -10 (-8)

Ole Miss -6 (-4)
Mississippi State

Texas Tech
Texas -14 (-16.5)

Washington State
Washington -16.5 (-15)

Oregon State
Oregon -20 (-16.5)

Georgia -8.5 (-10)
Georgia Tech

Virginia Tech -6.5 (-7)
Virginia

Ohio State -3.5
Michigan

Florida State
Florida -3 (-3.5)

Clemson
South Carolina -4.5

Kansas State -11 (-17)
Kansas

Alabama -21 (-21.5)
Auburn

Baylor
TCU -7 (-9.5)

Arizona
Arizona State -9 (-6)

UCLA
USC -4 (-7)

Notre Dame
Stanford -8 (-7)

Louisville -3.5 (-2.5)
Cincinnati

Oklahoma
Oklahoma State -4 (-3)

Texas -4.5 (-6.5)
Baylor 

Navy -6.5 (-7.5)
Army

College football season win totals: Here’s a look at prices found at several Vegas sportsbooks

Last week, we took a look at NFL season win totals being offered at various Las Vegas sportsbooks.

Now, after receiving a few requests, we turn our attention to college football.

The odds compare table below has a list of updated win totals from seven books around town, including Cantor, LVH, MGM, South Point, Station, William Hill and Wynn. As you’ll notice, the differences are few and far between, but it’s still worth shopping around.

Please note that all odds are subject to change, and that in some cases, they probably already have changed. Nonetheless, the table should offer a decent representation of where you can find the best price on the team and side you’re wanting to take.

Finally, those looking to bet Texas A&M are out of luck. The Aggies’ total is off the board at all books until Johnny Manziel’s status is decided.

* * *

TEAMCANTOR LVHMGMS POINTSTATIONWILLHILLWYNN
Alabama10.5 (o -290)11 (o -110)11 (u -120)11 (o -115)11 (u -145)11 (o -110)11 (o -120)
ArizonaXXX7.5 (o -145)7.5 (o -125)7.5 (u -115)7.5 (o -140)
Arizona St8 (u -160)8 (u -150)X7.5 (o -145)8 (u -130)7.5 (o -130)X
ArkansasXXXXXX5.5 (o -120)
AuburnXXXX6.5 (o -140)X7 (u -200)
BaylorXXXX8 (u -125)7.5 (o -125)X
Boise St9.5 (o -200)9.5 (o -200)10 (u -145)10 (u -130)10 (u -135)9.5 (o -135)10 (u -120)
BYUX7.5 (u -140)XXXXX
CaliforniaXXXXX4 (o -110)X
Clemson9.5 (o -120)9.5 (o -120)9.5 (o -115)9.5 (o -120)9.5 (o -120)9.5 (o -120)9.5 (o -125)
Florida9 (u -140)9 (u -140)9 (u -130)9 (u -135)9 (u -135)8.5 (o -130)9 (u -145)
Florida St10 (o -130)10 (o -125)10 (o -125)10 (o -115)10 (o -125)9.5 (o -130)10 (o -125)
Fresno St10 (u -140)XXXXXX
Georgia9.5 (o -130)9.5 (o -130)9.5 (o -125)9.5 (o -140)9.5 (o -140)9.5 (u -120)9.5 (o -125)
HawaiiXXXX3.5 (o -130)XX
Kansas StX7.5 (o -125)XX8 (o -120)7.5 (o -160)X
Louisville11 (u -210)10.5 (u -120)10.5 (o -115)10.5 (o -115)10.5 (o -130)10.5 (o -115)10.5 (o -130)
LSU8.5 (o -130)8.5 (o -120)9 (u -145)9 (u -150)9 (u -150)8.5 (o -110)9 (u -150)
Miami8.5 (u -120)8.5 (u -120)X8.5 (u -130)8.5 (u -130)8.5 (o -130)9 (u -200)
Michigan8.5 (u -145)8.5 (u -140)8.5 (u -150)8.5 (u -150)8.5 (u -130)8.5 (u -140)8.5 (u -130)
Michigan St8.5 (o -165)8.5 (o -135)X8.5 (o -150)8.5 (o -120)X8.5 (o -150)
N'WesternX7.5 (u -135)XX7.5 (o -135)XX
Nebraska9.5 (u -140)9.5 (o -110)X9.5 (o -120)9.5 (u -120)9.5 (u -130)9.5 (o -115)
Nevada6.5 (u -210)6 (u -140)5.5 (o -135)6 (u -140)6 (u -120)5.5 (o -150)X
N. CarolinaXXXX9 (u -120)XX
Notre Dame9 (u -185)8.5 (u -130)8.5 (u -130)8.5 (u -135)8.5 (o -115)9 (u -140)9 (u -200)
Ohio State10.5 (o -165)10.5 (o -165)10.5 (o -150)11 (u -185)10.5 (o -160)10.5 (o -175)11 (u -160)
Oklahoma8.5 (o -185)9 (u -145)9 (u -145)9 (u -150)8.5 (o -155)8.5 (o -145)9 (u -135)
Okla St.9.5 (u -135)9.5 (u -120)X9.5 (o -115)9.5 (u -145)X9.5 (u -130)
Ole MissX7.5 (u -120)XXX7.5 (o -120)X
Oregon11 (u -145)11 (u -120)11 (u -135)11 (u -140)11 (u -140)10.5 (o -155)10.5 (o -210)
Oregon StX8 (o -140)X8.5 (u -130)8.5 (u -130)8.5 (u -130)X
Penn StateXXX8 (o -120)8 (u -120)X8 (u -115)
S. Carolina9.5 (o -115)9.5 (u -120)9.5 (u -130)9.5 (u -130)9.5 (u -130)9.5 (o -125)9.5 (o -130)
Stanford9.5 (o -120)9.5 (u -130)9.5 (o -115)9.5 (u -125)9.5 (u -130)9.5 (u -125)9.5 (o -115)
TCU8 (o -165)8 (o -130)XX8 (o -130)8 (u -125)8 (o -150)
TennesseeXXXX6 (u -120)5.5 (o -135)6 (o -150)
Texas9.5 (-135)9.5 (o -130)9.5 (o -115)9.5 (o -130)9.5 (o -125)9.5 (u -125)9.5 (o -130)
Texas A&MOFFOFFOFFOFFOFFOFF OFF
UCLA7 (u -145)6.5 (o -160)7 (o -120)7 (u -140)7 (u -120)7.5 (u -115)X
UNLV3 (o -320)3.5 (o -140)3.5 (o -140)3.5 (o -150)3.5 (o -120)4 (u -125)X
USC9.5 (u -130)9.5 (u -120)9.5 (u -135)OFF9.5 (u -130)9.5 (u -140)9 (o -170)
UtahX5.5 (u -150)XX5.5 (u -155)XX
Va Tech8.5 (o -140)XX8.5 (o -145)8.5 (o -150)8.5 (o -110)8.5 (o -145)
WashingtonX7.5 (o -110)X7.5 (u -125)7.5 (o -115)7.5 (u -145)X
W. VirginiaXXXX6 (o -115)XX
Wisconsin9 (o -135)9 (o -135)X9 (o -135)9 (o -115)8.5 (o -140)9 (o -135)

Unbeaten odds: Alabama has best chance to run the table, but Ducks aren’t far behind

The SEC has won the last seven national championships and is favored to make it eight straight, as BCS favorite Alabama—in addition to Texas A&M, Georgia, South Carolina and Florida—are all expected to contend in 2013.

By using projected point spreads (derived from Games of the Year lines), we’ve calculated win odds for each team and determined their chances of remaining unbeaten throughout the regular season.

As you might expect, the Crimson Tide have the best chance (47.9%) to run the table and are a projected favorite of at least a touchdown in all 12 regular season games.

The next most likely team to finish a perfect 12-0?

Third-ranked Oregon.

The Ducks, playing under first-year coach Mark Helfrich, won’t be challenged until an Oct. 12 matchup at Washington and have a 44.2-percent chance to finish unbeaten. They’re a projected favorite in every game, and would be the likely favorite against the Pac-12 South champion in the conference title game.

Other teams with realistic chances of finishing unbeaten: Ohio State (28.7%), Louisville (16.2%) and Florida State (10.5%).

The first 10 weeks for each team are listed in the table below. [Click here for all weeks]

* * *

RANKTEAM123456789101112131415
1Alabama96%96%60.5%60.5%55.0%55.0%55.0%55.0%55.0%55.0%47.9%47.9%47.9%47.9%
2Ohio St.100%100%100%100.0%77.0%52.4%52.4%52.4%45.6%44.2%44.2%44.2%44.2%28.7%
3Oregon100%100%100%100%100%100%85.0%85.0%85.0%85.0%56.1%56.1%46.6%44.2%
4Stanford100%100%100%75.0%72.8%58.2%48.3%38.2%20.6%20.6%7.0%3.5%3.5%2.2%
5Georgia52%35.4%35.4%35.4%23.3%18.9%17.8%13.3%13.3%8.3%8.3%7.3%7.3%5.5%
6Texas A&M100%100%37.0%37.0%32.6%32.6%19.9%19.9%17.7%17.7%17.7%17.7%9.0%7.5%
7South Carolina80%25.6%21.0%21.0%17.4%17.4%13.9%10.3%7.6%6.7%6.7%4.2%4.2%2.7%
8Clemson48%48%48%38.4%38.4%28.8%28.8%14.7%12.2%10.1%10.1%7.8%7.8%2.8%
9Louisville100%100%84%84%84%74.8%62.1%51.5%41.7%41.7%33.8%30.1%30.1%30.1%16.2%
10Florida100%53%53%44.5%42.7%38.0%14.5%10.1%10.1%3.8%3.1%1.2%1.2%0.6%
11Notre Dame100%50%41.5%29.1%14.5%9.0%9.0%5.6%5.4%5.0%4.0%4.0%3.2%1.2%
12Florida St.77%77%77%77%73.2%73.2%73.2%35.8%34.8%26.1%24.5%22.3%22.3%10.5%
13LSU62%62%62%59.5%20.2%15.6%9.7%4.8%4.8%4.8%0.6%0.6%0.3%0.3%
14Oklahoma St.83%83%83%83%62.3%46.7%46.7%35.0%29.4%22.1%22.1%8.4%6.8%6.8%3.7%
15Texas100%75%51%39.3%39.3%34.2%21.2%21.2%12.9%12.9%10.3%6.4%6.4%5.6%3.8%
16Oklahoma100%89%83.7%83.7%41.8%31.4%15.4%15.4%13.4%13.4%8.7%8.7%5.0%5.0%2.3%
17Michigan100%50%50%41%41%36.1%18.0%16.1%16.1%7.5%4.6%2.2%1.7%0.6%
18Nebraska100%100%66.0%66.0%66.0%64.7%49.8%49.8%37.4%22.8%8.9%5.5%2.8%2.4%
19Boise St.39%39%38.2%19.1%19.1%19.1%14.3%13.0%6.5%5.7%5.7%5.7%3.7%3.7%
20TCU38%38%21.7%21.7%21.7%5.4%5.4%1.4%0.5%0.4%0.3%0.1%0.1%0.1%
21UCLA100%100%34.0%34.0%34.0%21.8%19.4%4.1%0.0%0.0%0.0%0.0%0.0%0.0%
22Northwestern65%52.7%52.7%52.7%52.7%16.8%6.1%5.3%4.0%1.5%1.5%0.8%0.5%0.4%
23Wisconsin100%100%50%47%10.8%10.8%6.9%6.1%6.1%4.9%3.7%3.4%2.7%2.0%
24USC100%100%100%96.0%48.0%48.0%33.6%12.8%11.4%5.7%5.0%2.5%2.5%1.8%
25Oregon St.100%100%70%46.2%46.2%46.2%38.3%31.4%14.5%7.2%7.2%3.1%2.0%0.1%